Experiment of BIT part: Check the DNA strand non-linear amplification system
Object
First, we confirmed whether the nonlinear α strand amplification is done by PEN DNA tool box and drain α system by measuring the intensity of fluorescent marker of α strand.
Method
We prepared 8 samples with following condition. the samples were incubated at 40 degrees for 2 hours in a thermal cycler. Then we traced the fluorescent level of α.
| α 0 nM | α 100 pM | α 1 nM | α 10 nM | |
| drain α 20 nM | sample 1 | sample 2 | sample 3 | sample 4 |
| drain α 0 nM | sample 5 | sample 6 | sample 7 | sample 8 |
Result and Discussion
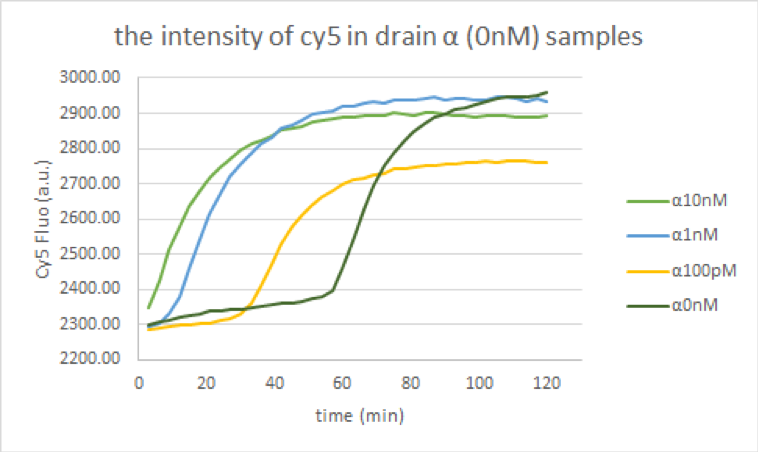
Fig.1 Fluorescence intensity of samples which differ the initial concentration of α strands (10nM,1nM,100pM,0nM) in no drain α condition.
In the condition without drain α, it was observed that the fluorescence intensity got higher and reached to plateau in all samples, which started α strand amplification faster in the order of α 10nM, 1nM, 100pM, and 0nM.
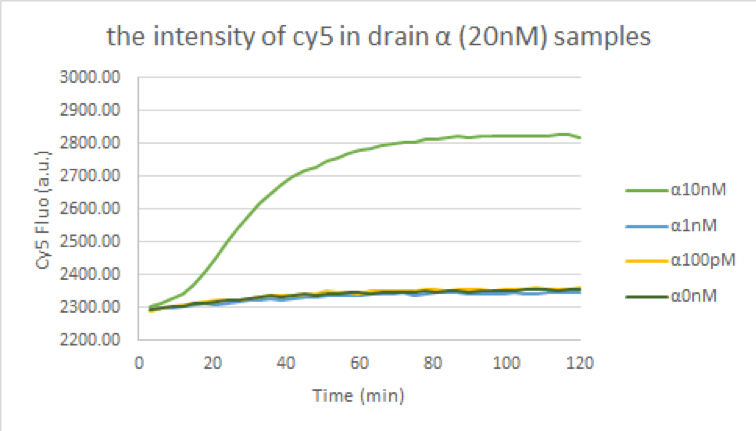
Fig.2 Fluorescence intensity of samples which differ the initial concentration of α strands (10nM,1nM,100pM,0nM) in drain α 20nM condition.
The intensity of fluorescence increased and reached to plateau only in the condition of α 10nM after 2-hour incubation. On the other hand, the intensity of fluorescence in the other samples were not changed dramatically. Therefore, it is thought that PEN and drain α system can amplify strand α nonlinearly depending on the initial α strand concentrations.
Compared with the drain α 20 nM and 0nM conditions, it is showed that α nonlinear amplification system works with the existence of drain α.
Experiment of CLOT part 1: Confirm that linker aggregates the D1,D2 beads
Object
We aimed to check the linker can make D1 and D2 beads aggregated by using microscope.
Method
We prepared four different concentrations of linker solutions (10 µM, 1 µM, 0.1 µM, control), and added them to the solution which beads D1 and D2 were in. We incubated each solution at room temperature for 1 hour and observed them with a microscope.
Result and Discussion
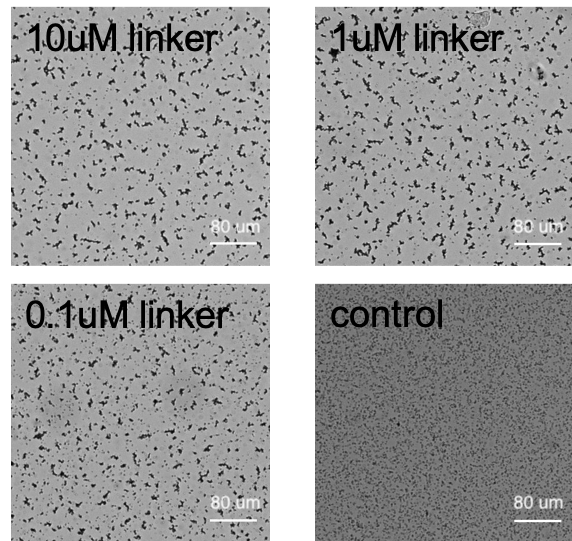
Fig.1 Microscopic images of each solution after one-hour incubation. Scale bar= 80 µm.
The beads aggregated when we put the linker into D1 and D2 solutions at any linker-exist samples (0.1 µM, 1 µM, and 10 µM). In contrast, the aggregation was not observed in control condition. Therefore, the linker correctly functioned.
Experiment of CLOT part 2: Confirm conversion from α to linker
Object
In next step, we tried to find whether α to linker can make the linker strand amplified by observing the fluorescence of DNA binding.
Method
We prepared 4 samples(2 samples included α to linker, the others did not). the samples were incubated at 45 degrees for 2 hours in a thermal cycler. Then we traced the intensity of fluorescent maker, which detect the binding of DNA.
Result and Discussion
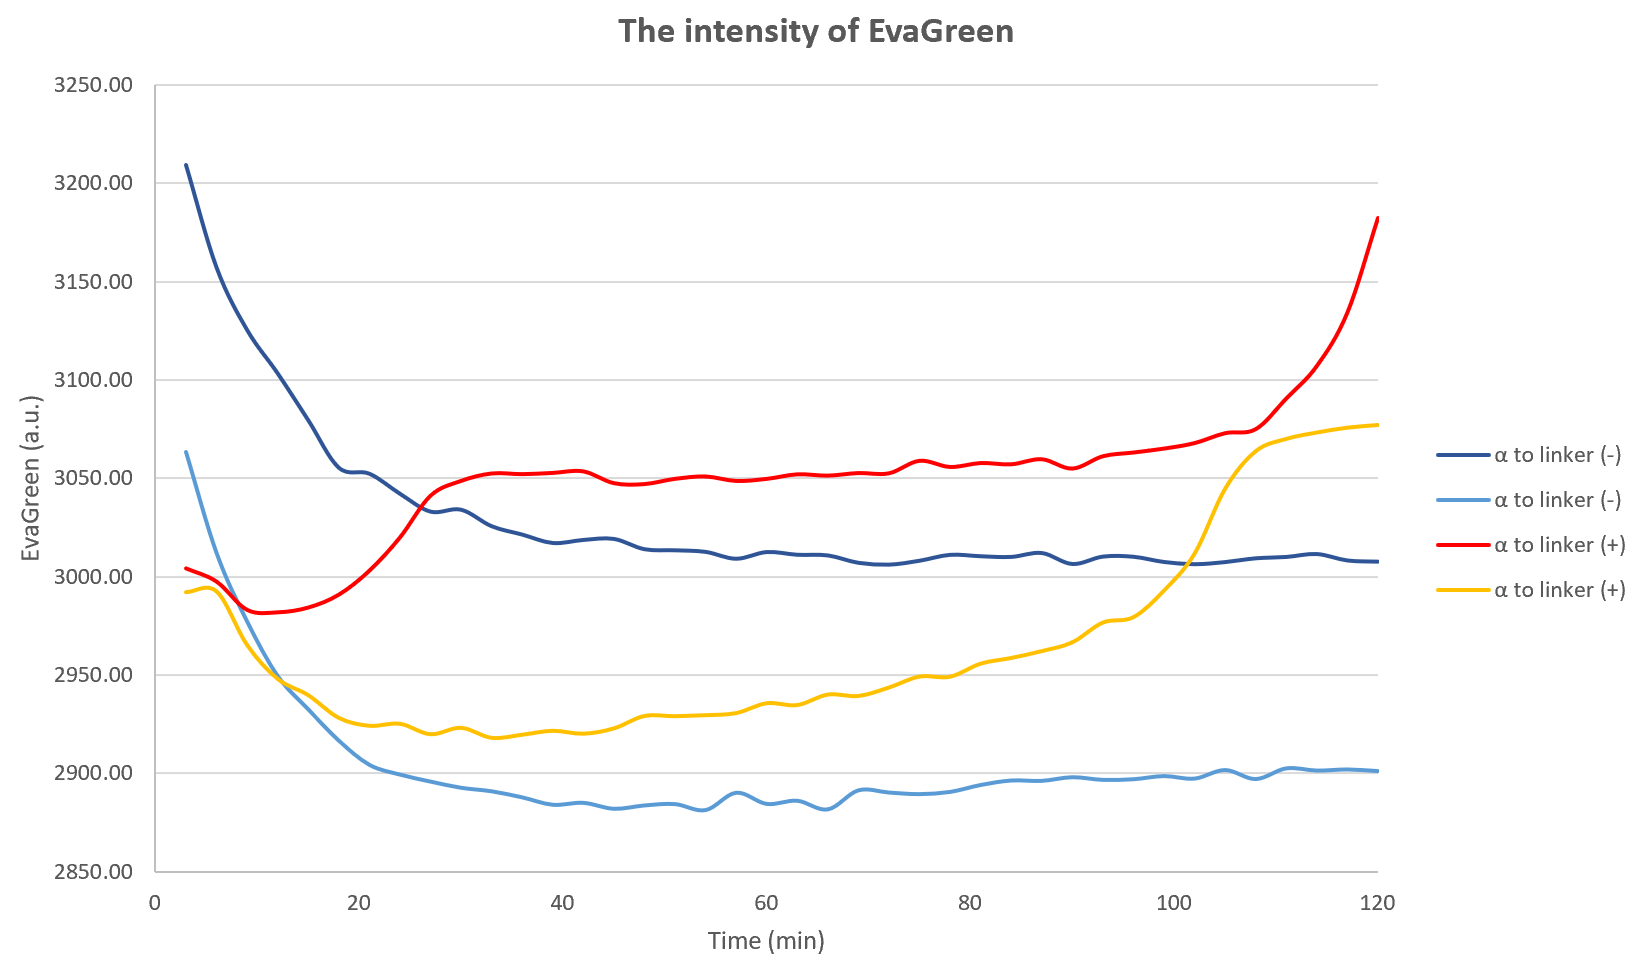
Fig.4 Fluorescence intensity of samples with α to linker templates or no templates. The observation time is from 0 to 2 hours.
Compared with sample with no α to linker samples, the fluorescent intensity increased in α to linker samples. Although EvaGreen detects all DNA bindings in solution, this result suggests that the linker strands amplified by the template.
Experiment of BIT CLOT part: Whether we can achieve nonlinear beads aggregation
Object
We aimed to observe the non-linear beads aggregation depending on the initial concentration of α applying α strand non-linear amplification system (BIT) and beads aggregation (CLOT). We checked the aggregation using microscope.
Method
We prepared 9 samples and put different concentration of α (0,100,200,300,400,500,600,700,800 pM) in α strand amplification and beads aggregation system solution. Then we put them in the lanes of chamber. We incubated each solution at 45 degrees, then traced them with a microscope for 6 hours.
Result and Discussion
.gif) |
.gif) |
.gif) |
.gif) |
.gif) |
.gif) |
.gif) |
.gif) |
.gif) |
Fig.5 The movies of aggregation of beads. The observation time is from 0 to 6 hours. (upper row: 0pM, 100pM, 200pM. middel row: 300pM, 400pM, 500pM. bottom row: 600pM, 700pM, 800pM.)
In the condition of drain α 20nM, the threshold of α is between 700pM and 600pM.The degree of aggregation is almost the same when the concentration of α is lower than 600pM and when higher than 700pM, so it can be said that we can achieve non-linear aggregation system.